如何制作数据可视化大屏的城市地图

最近接到一个新需求,在大屏上展示一个地图,这篇文章来记录下。
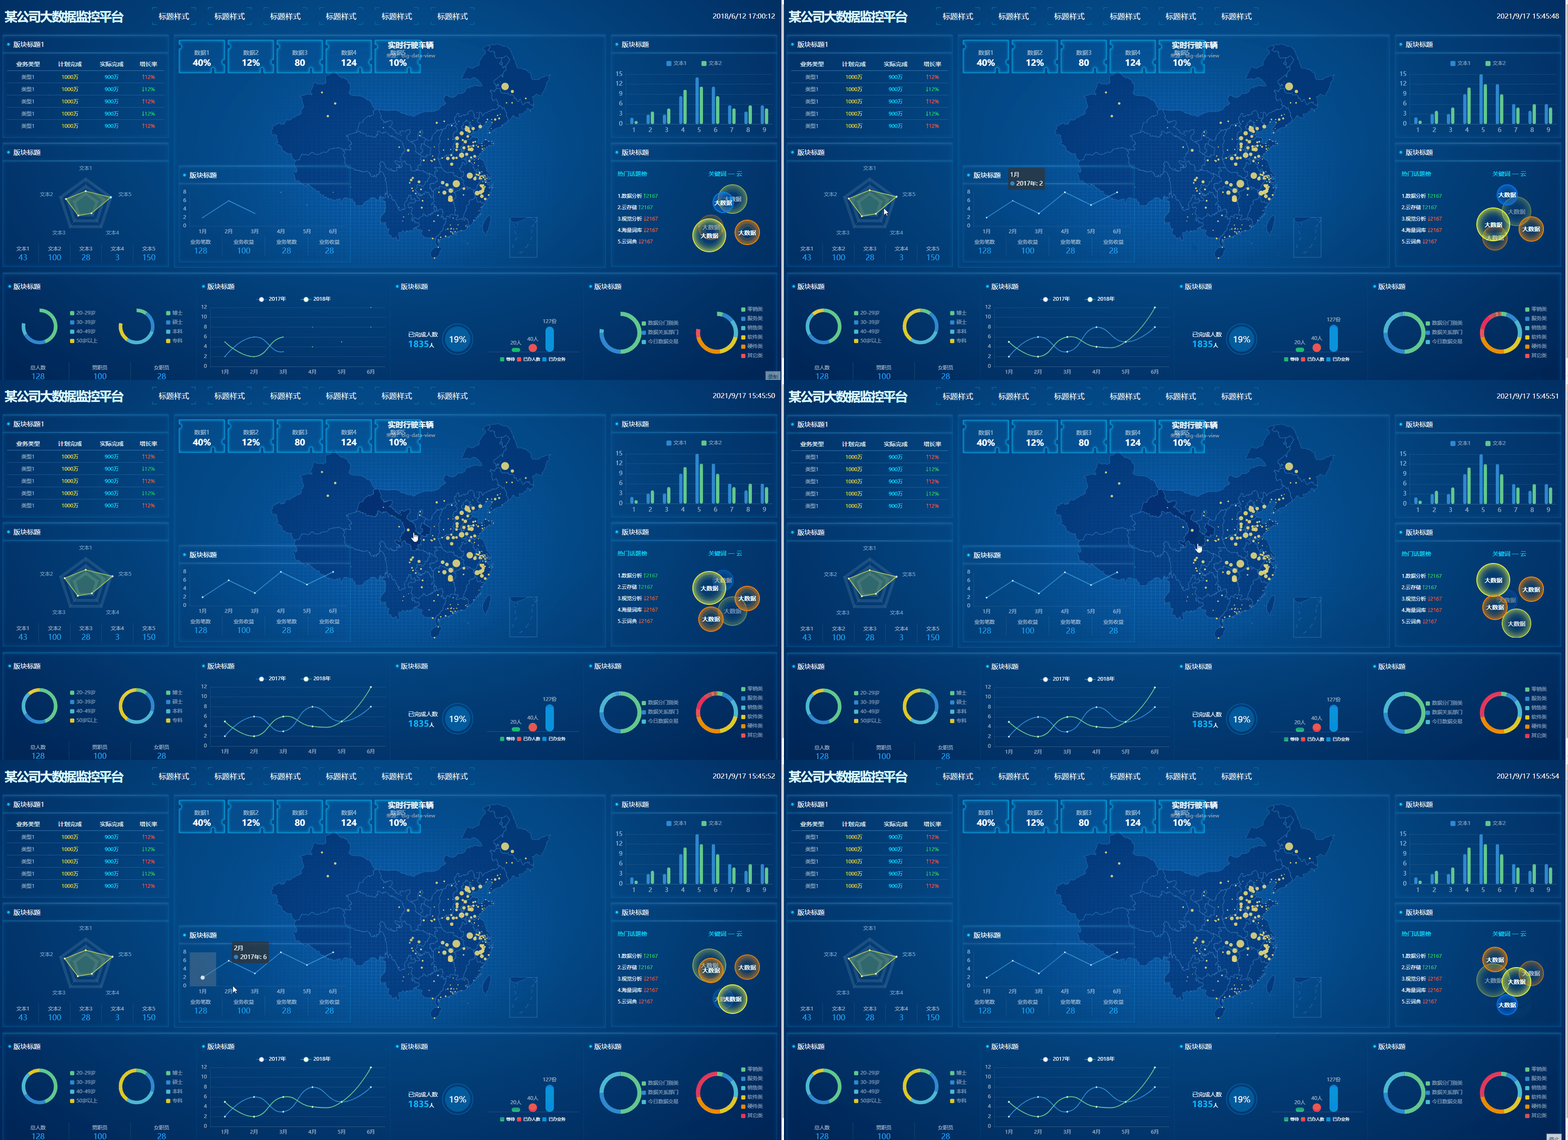
图片来自 https://igaowei.github.io/BigDataView/

Echart 结合百度地图

地图下钻到区县还是容易做的,最好是百度地图,后期不用自己更新地图数据 json 了,但是样式是整个中国地图样式,看起来东西太多。

可以看到官方提供的案例, 前往https://lbsyun.baidu.com/solutions/mapvdata查看更多。

https://mapv.baidu.com/gl/examples/editor.html#circle.html
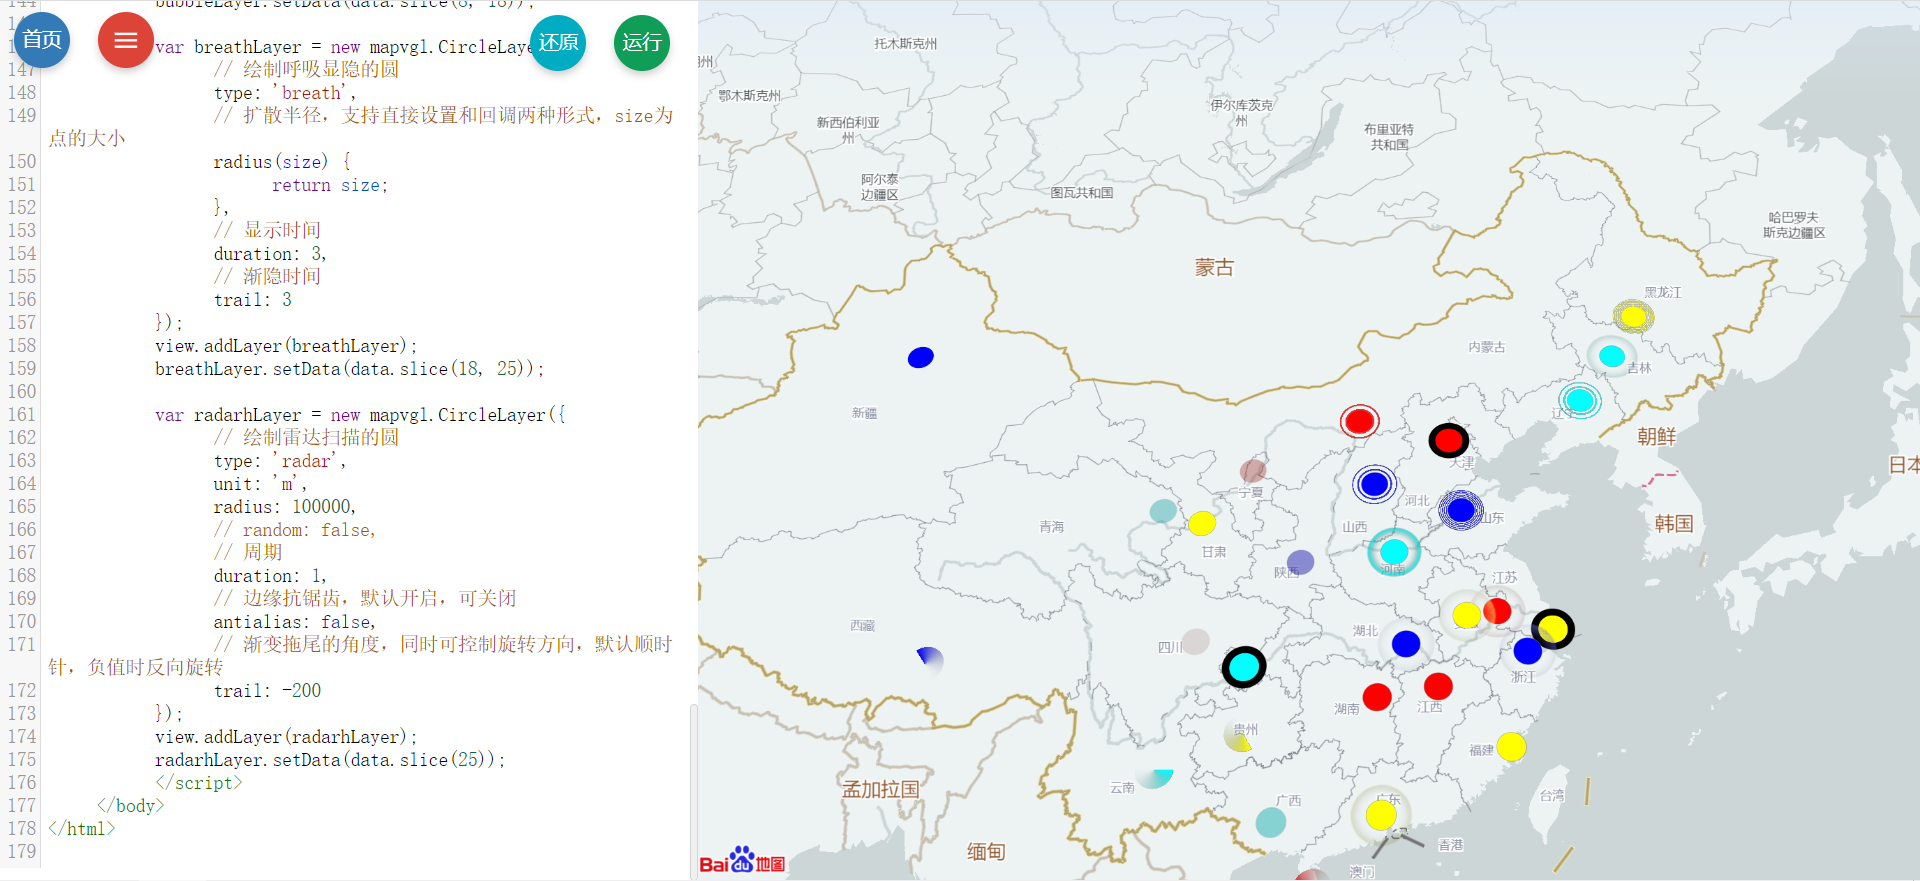
首先到百度地图https://lbs.baidu.com/index.php?title=jspopularGL/guide/getkey申请一个ak key,然后在代码中加载百度地图 api

echart 提供了 demo: https://echarts.apache.org/examples/zh/editor.html?c=effectScatter-bmap

Echart 来开发某区的地图

DataV.GeoAtlas 地理小工具系列,通过网站,能得到【省、市、县、区】的地理坐标数据。非常方便

https://datav.aliyun.com/portal/school/atlas/area_selector

点击点击寻找到你的地区,然后粘贴到你的地理坐标数据 json

1
2
3
4
let cqMapChart = echarts.init(document.getElementById("map"));
echarts.registerMap(this.mapName, require(`[json路径]`));
cqMapChart.resize();
cqMapChart.setOption(option, true);

可以做到这样的效果,按色块来展示每一个地图

Echart 来开发街道、乡镇的地图

使用制图软件 bigemap, 我们只需要用到免费功能就能做,过程有点复杂

  • 下载软件 bigemap

http://www.bigemap.com/

  • 导出该区所有街道的 bmv 格式数据

  • 直接将 bmv 格式文件拖入视图

  • 右击下载地图

这里的 kml 文件就是我们最终需要的。

一次只能一个任务,记得在这里点取消

  • 汇集地图

  • 数据合并

我们前往https://geojson.io/#new&map=7.18/33.498/119.9,把所有的 kml 文件直接拖进左侧,然后右侧就会生成我们需要的数据

代码

1
2
3
4
5
6
7
8
9
10
11
12
13
14
15
16
17
18
19
20
21
22
23
24
25
26
27
28
29
30
31
32
33
34
35
36
37
38
39
40
41
42
43
44
45
46
47
48
49
50
51
52
53
54
55
56
57
58
59
60
61
62
63
64
65
66
67
68
69
70
71
72
73
74
75
76
77
78
79
80
81
82
83
84
85
86
87
88
89
90
91
92
93
94
95
96
97
98
99
100
101
let option = {
layoutCenter: ["50%", "50%"], //位置
layoutSize: "86%",
tooltip: {
show: true,
trigger: "item",
backgroundColor: "rgba(0, 21, 77, 0.74);", //浮框背景
borderColor: "#7FE2F5",
textStyle: {
color: "white",
},
borderWidth: 1,
padding: 5,
},
geo: {
show: true,
map: this.mapName,
label: {
normal: {
color: "white",
fontSize: 10,
show: true, //显示省份名称
},
},
tooltip: {
trigger: "item",
},
roam: false,
zoom: 1.0,
itemStyle: {
normal: {
show: true,
areaColor: "rgba(43, 196, 243, 0.7)",
borderColor: "rgba(43, 196, 243, 1)",
borderWidth: 1,
shadowBlur: 20,
shadowColor: "rgba(0, 0, 0, 0.5)",
},
emphasis: {
show: true,
areaColor: "#24cbff",
shadowBlur: 20,
shadowColor: "rgba(0, 0, 0, 0.5)",
},
},
},
geo: {
regions: [
{
itemStyle: {
normal: {
areaColor: colors, // 颜色
borderColor: "rgba(43, 196, 243, 1)",
},
},
},
],
},
series: [
{
name: "服务中",
type: "effectScatter",
coordinateSystem: "geo",
symbolSize: 6,
data: [],
itemStyle: {
normal: {
show: true,
color: "#00fea6",
shadowBlur: 100,
shadowColor: "#fff",
},
},
rippleEffect: {
brushType: "stroke",
},
},
{
name: "已服务",
type: "scatter",
coordinateSystem: "geo",
symbolSize: 6,
animation: false,
data: [],
itemStyle: {
normal: {
show: true,
color: "#fafa01",
shadowBlur: 100,
shadowColor: "#fff",
},
},
data: [],
},
],
};
cqMapChart = echarts.init(this.$refs.map, null, {
renderer: "svg",
});
echarts.registerMap(this.mapName, mapJson);
cqMapChart.setOption(option, true);

最终效果

附上链接

我最近在用的5个好东西 uniapp中接入融云-IM 云服务

Your browser is out-of-date!

Update your browser to view this website correctly. Update my browser now

×